It turns out that you cannot hide a chart in Excel from within VBA directly
You need to treat it as shape
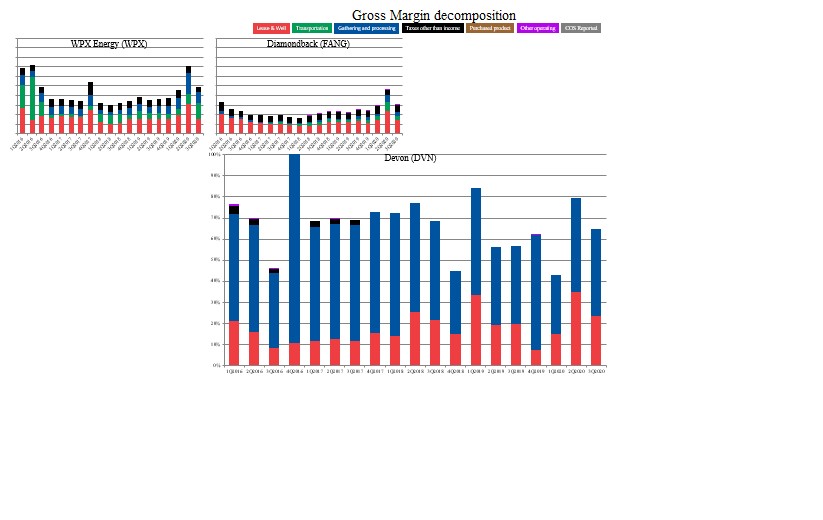
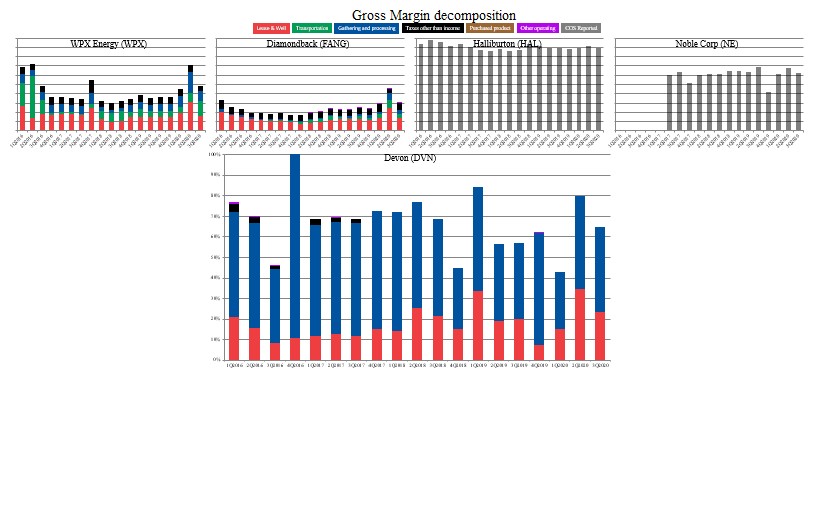
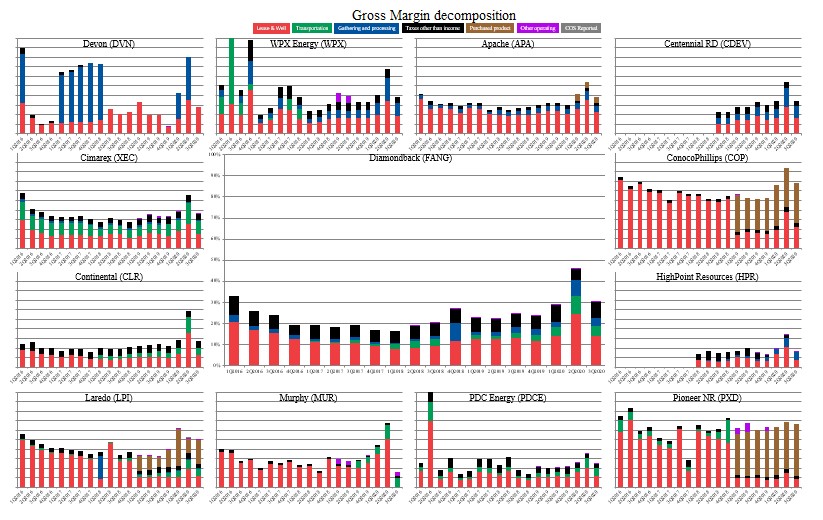
I needed to automatically hide some of 12 charts if there is no data in any them.
So, I went with what I found by hiding them after treating them as shape, not as chart
So, this line will not work
ActiveChart.Visible = False
Nor this line
ActiveChart.ChartArea.Visible = False
But this will
ThisWorkbook.Worksheets(ChShee).Shapes(ChN).Visible = msoFalse ' msoTrue
Full code needed to show/hide chart (or shape)
' by default all charts are visible
' Except when we have no company shown in table, then, we hide chart
ChartVisi = msoTrue
If ThisWorkbook.Worksheets(ChShee).Range(Ch2 & 3) = "" Then ChartVisi = msoFalse
ThisWorkbook.Worksheets(ChShee).Shapes(ChN).Visible = ChartVisi
Views 803
Downloads 258
CodeID
DB ID


